
Can indicators and metrics guide resilience adaptation?
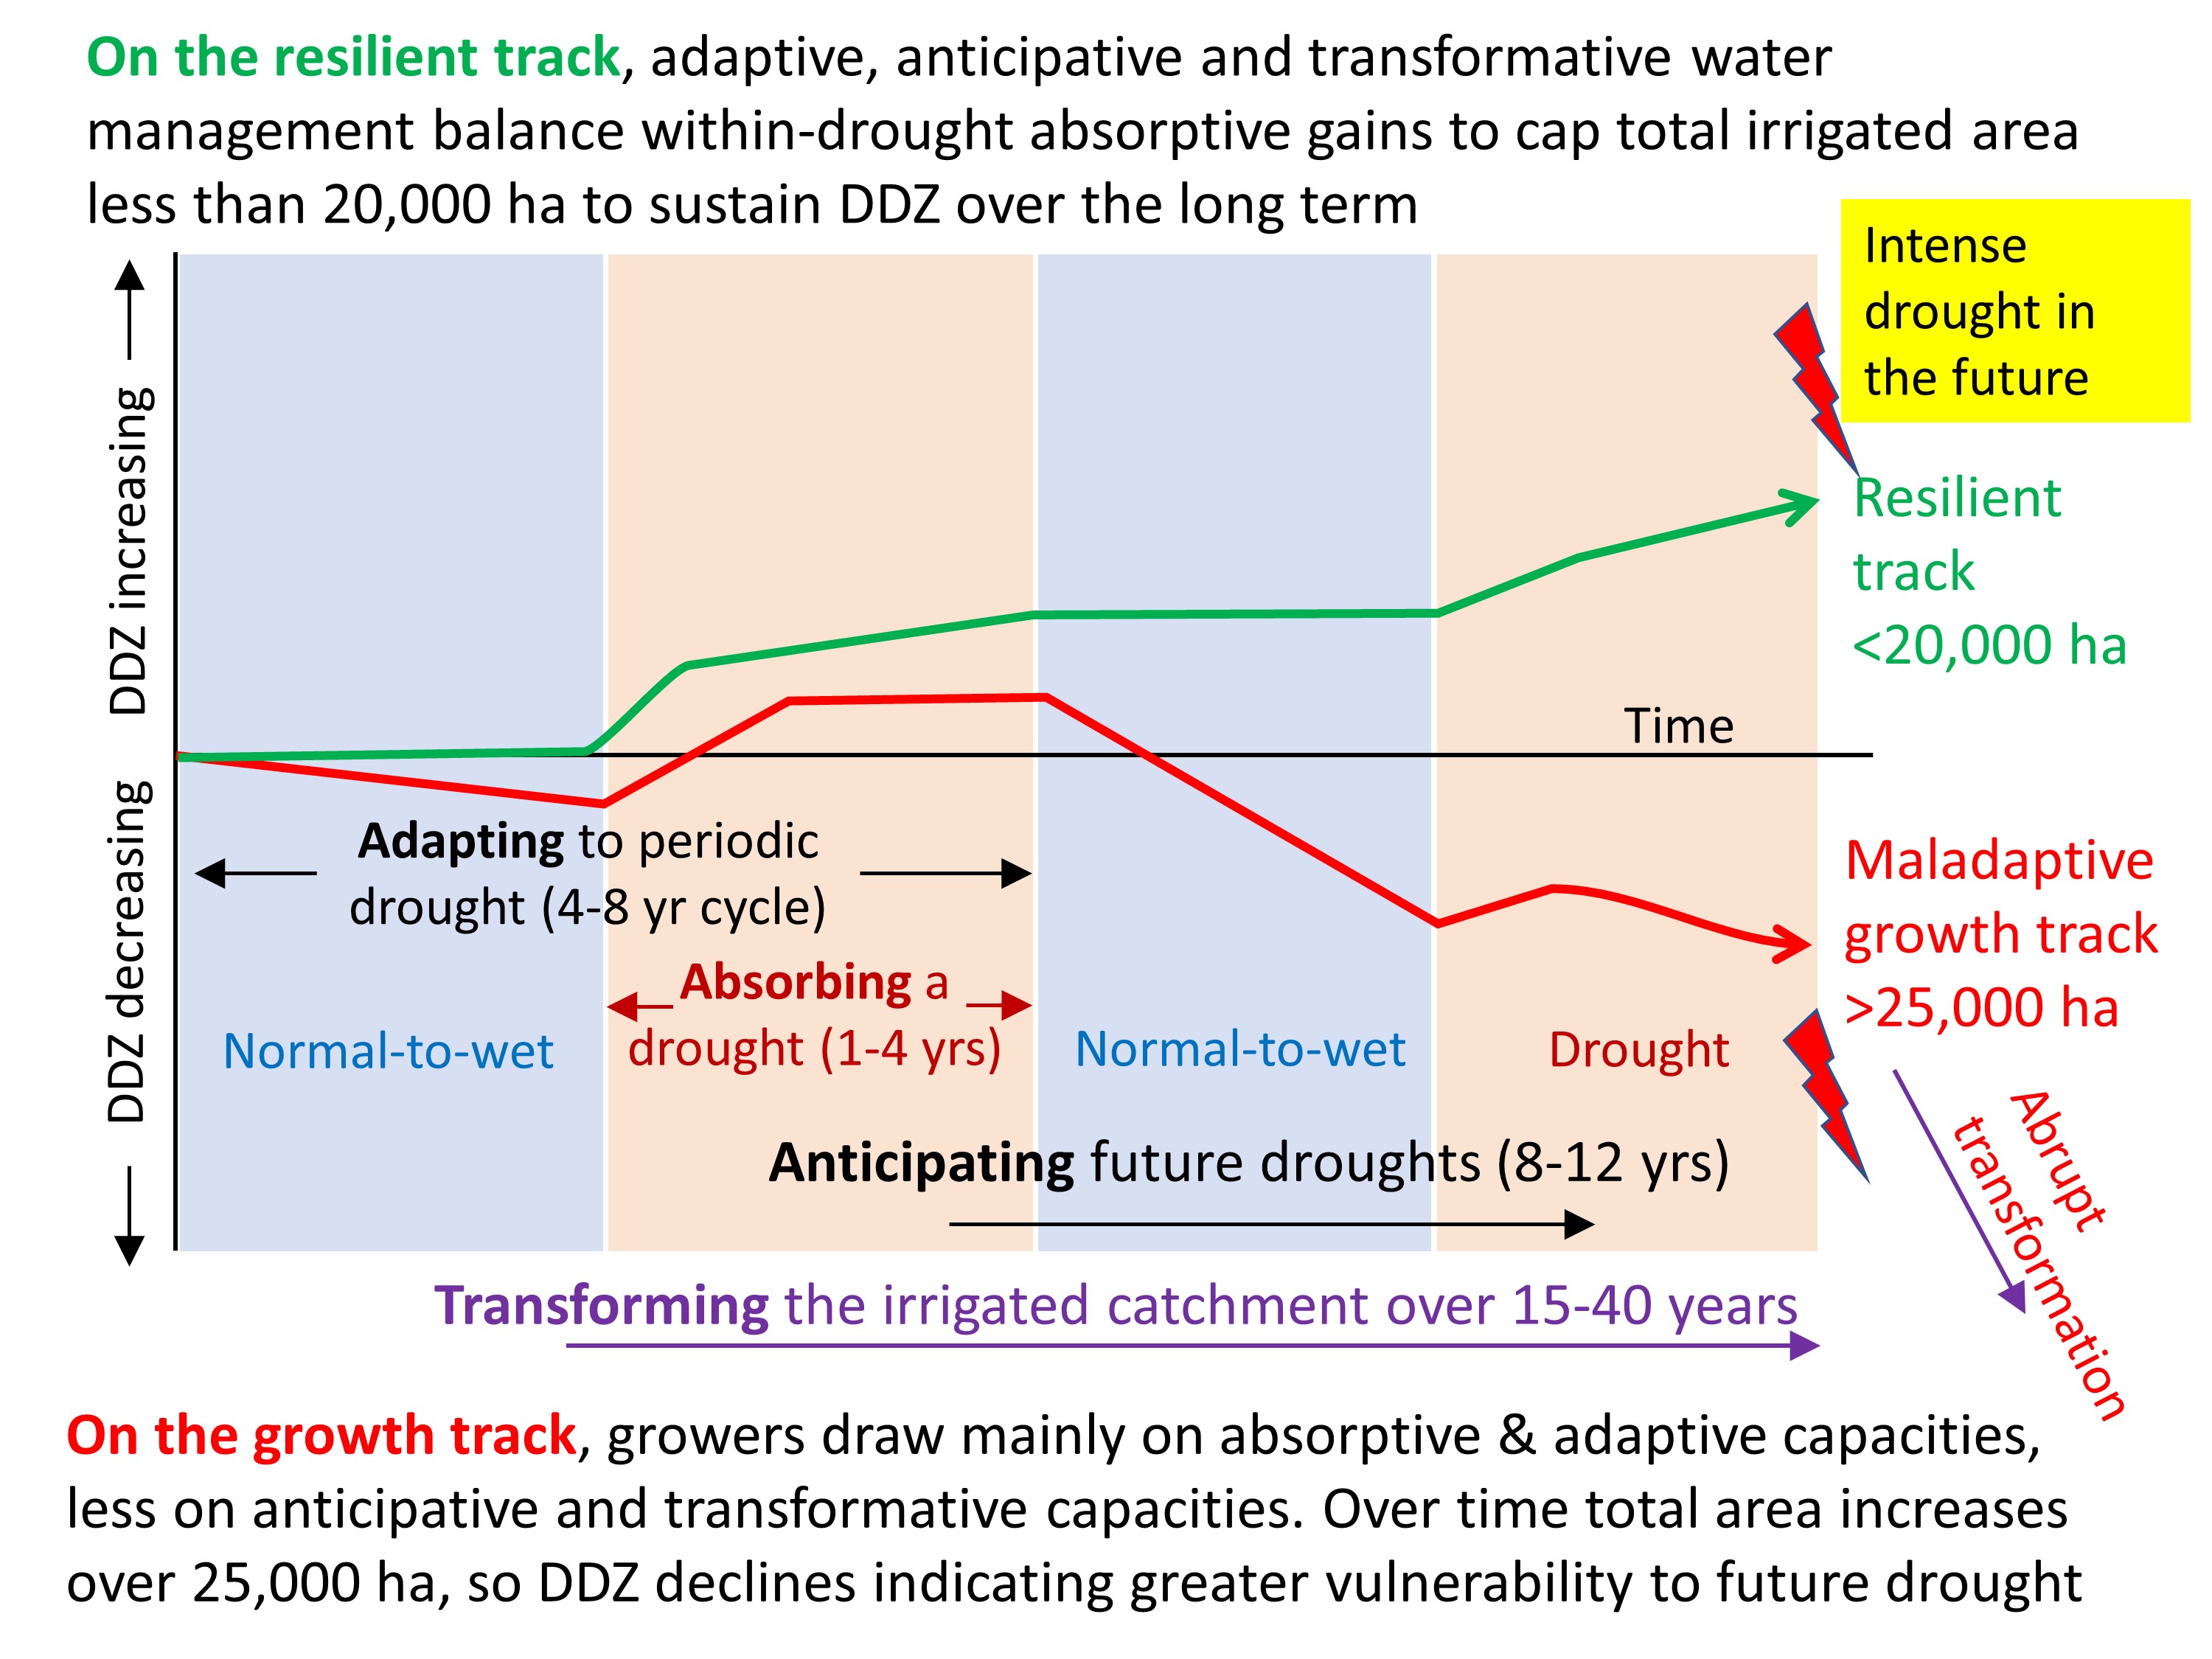
The diagram above shows two adaptation pathways for irrigated agriculture in a semi-arid drought-prone catchment over a period of 8-12 years. One pathway in green is becoming more resilient to drought shown by rising ‘Days to Day Zero’, meaning it is more likely to cope with a severe drought in the future. The other maladaptive or ‘growth’ pathway in red is becoming less resilient to drought – reflected in the DDZ declining over time. Amongst many factors driving this change is an increasing area of irrigation enabled by consolidation of farms with generous historical water rights, higher irrigation efficiency and more storage. The numbers come from research in the Groot Letaba in South Africa.
I argue here that the indicator Days to Day Zero (DDZ) both reveals the evolving resilience of a water system to water scarcity and drought, and can guide a conversation about adaptation and maladaptation.
In their paper, Schipper and Mukherji (2024) discuss the importance of distinguishing adaptation from maladaptation and how, with qualifications, measurement and indicators should help make this judgement. Accordingly, on page 624 they write; “Two dimensions of adaptation in particular have received considerable focus: the risk of maladaptation, and the contention that any metrics to assess success are likely to fall short of capturing all dimensions of adaptation.”
This blog expands on their paper drawing on two published articles (Lankford et al., 2023, Lankford and Agol, 2024). In a nutshell, these two papers and this blog contend that; a) a resilience indicator called Days to Day Zero can guide discussions on the difference between irrigation adaptation and maladaptation, and b) when responding to system vulnerability or poor adaptation we need to take a cross-scale whole systems approach. In other words, we should not see ‘irrigation’ as unadulterated comprising only one variable – such as efficiency or area or volume withdrawn. I take issue with papers that leave irrigation unpacked, saying for example farmer-led smallholder systems are resilient but efficient irrigation systems are not. One example of this (Matthews et al. 2022) does not mention the many other factors that mediate how much water is withdrawn and consumed relative to supply – and thus how sensitive the system is to a sudden downturn in supply. Examples of other factors include cumulative command area, seasonal depth applied, and the dynamic characteristics of rainfall, water supplies and storages. Far from opening up dialogue to the complex trade-offs involved, summary positions seem to narrow down options.
Some background to the two published articles: Lankford et al. (2023) reports on research conducted in South Africa during the period 2017–2020, on the resilience of irrigated agriculture to drought. This paper developed the ‘Water, Efficiency, Resilience, Drought’ (WERD) framework and model. Lankford and Agol (2024)** examined situations when irrigation as a drought or dry-spell strategy becomes too consumptive for its locality which, in keeping with Schipper and Mukherji’s arguments, compromises downstream water users. Lankford and Agol say that to manage this and keep it from happening, requires us to see the difference between irrigation as the act of adding water (running the risk of maladaptation) and irrigation as a full complex cross-scale system. The latter welcomes more actors to consider more factors that either maintain irrigation within its envelope of water availability or grow sustainably to fill that envelop.
In this short blog, I do not repeat the explanation, findings and discussion given in Lankford et al., (2023) and Lankford and Agol (2024). For example, the paper and WERD model found in the appendix of Lankford et al. 2023 explain how irrigation efficiency, command area, and other factors determine the changing volumes of water withdrawals from a large storage body. Instead, this blog is divided into two parts, an introduction to DDZ, followed by a brief discussion.
Introduction to DDZ; what it is and can do, and what it should not do.
• Days to day zero (DDZ) is a resilience indicator of a complex water system such as a semi-arid irrigated catchment. DDZ is designed show how resilient this water system is to water shortages, and how this can change over time. In simple terms, DDZ shows how well adapted or how vulnerable a system is to water scarcity especially via severe drought. In simple terms, a high DDZ signals a system with ample supply surplus to demand and a high likelihood of coping with a long-term drought.
• Thus, when water storage and supply relative to water demand goes up, DDZ goes up, and when water demand goes up relative to supply and storage, DDZ goes down.
• DDZ is intuitive and easy to understand because the metric is ‘days’; a system with 300 days DDZ can last a drought of 300 days before it runs out of water, and 300 DDZ is more resilient than a DDZ of 50 days.
• This means that if irrigation demand (itself a function of area, irrigation efficiency, rainfall and crop type, amongst other factors) goes up, then DDZ goes down. A declining DDZ over time is a red flag that, in keeping with Schipper and Mukherji, the increase in irrigation has become maladaptive. This is captured in the diagram below showing that with the growth of irrigation over time, DDZ starts to fall.
• All the calculations for DDZ sit in the background, meaning relevant land and water units of demand and supply (e.g. litres/second, cubic metres, mm depth, hectares) are rendered into ‘days’.
• In the 2023 paper, we discussed how absorptive, adaptive, anticipative and transformative capacities can change DDZ. The diagram at the top of the blog says that over a series of droughts in a drought-prone area, water consumed in irrigation over time can ratchet up when efficiency gains and more storage are converted into more irrigated area. This conversion remains adaptively sound provided the collective irrigated system and its stakeholders reflect on adsorptive, adaptive and anticipative strategies to know when the limits of this conversion are being reached, so that future scenarios are less cumulatively consumptive during a future drought. However, if stakeholders can absorb a single drought but are less adaptive and anticipative over longer cycles of periodic drought, they run the risk of being maladaptive in the long run. In other words, ceteris paribus, efficient large command areas (the red pathway above) are going to be more vulnerable to drought compared to efficient small command areas (the green pathway above).
• DDZ is not an accurate hydrological model of how much water is in the system. Rather, DDZ acts as an intermediary boundary object that invites different actors to a debate, acknowledging that different actors will see the system differently. Also DDZ should not to be used for behavioural nudging during a drought as ‘Day Zero’ was in Cape Town – see Warner and Meissner (2021).
• A simplified version of the WERD model can be downloaded here. The new simple front dashboard plugs into the original WERD model so that users can adjust irrigation area, efficiency, ETo, rainfall, and storage to see how DDZ adjusts. To use more determining factors, please navigate to the original WERD model which is given here. (Note and with apologies: I accept the model is not very user-friendly. May I add, it took two attempts and a lot of versions to arrive at a functioning DDZ model. With more time and resources, it could be made into a more universal easy-to-use model – please keep an eye on some developments in this regard).
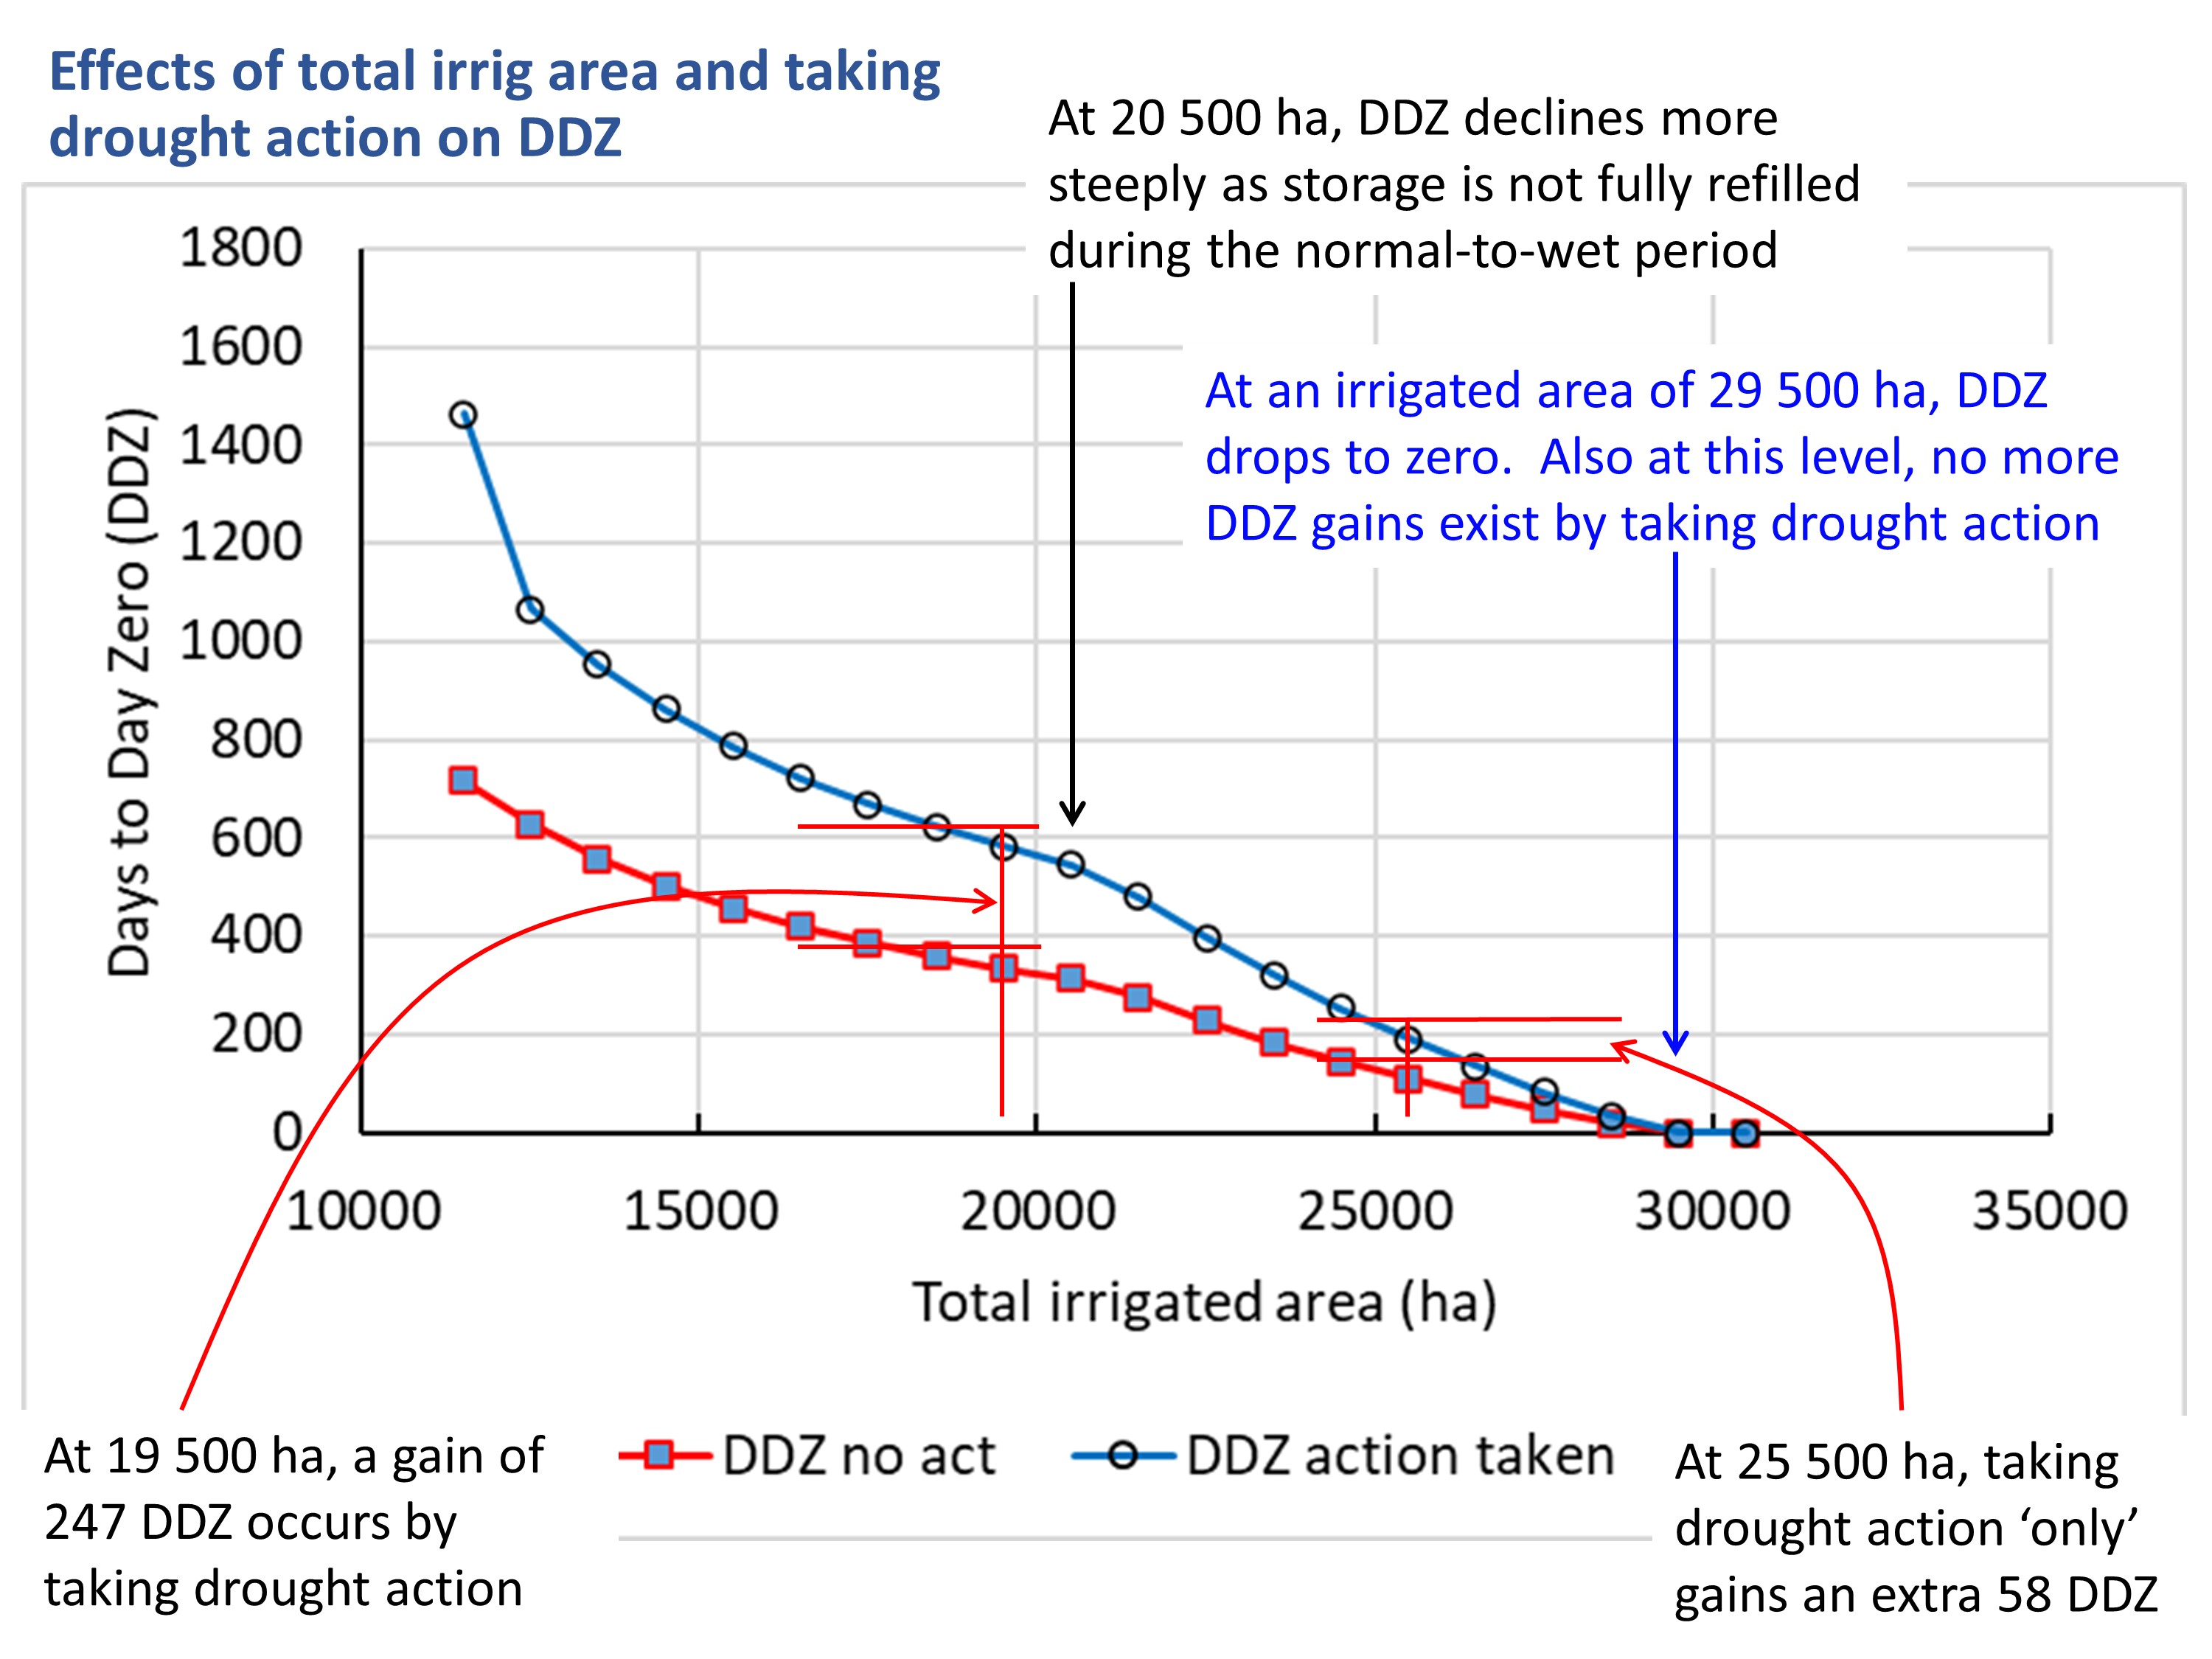
The diagram shows two lines declining with every increase in total irrigated area. The blue line is when ‘drought action’ is taken to absorb the drought to keep perennial crops living and producing. Here additional measures are taken to withdraw and consume less water from water storages, for example using deficit irrigation. The red line is when drought action is not taken during a drought. The blue line is above the red line because for any given total area of irrigation, DDZ is boosted by taking drought action. However with increasing area, the scope for raising DDZ decreases because, despite taking drought action, the area under irrigation has simply become too large. The DDZ model shows that keeping the cumulative area under 20,000 ha enables the system to be more resilient – and cope with a drought of about 250 days. The numbers come from research in the Groot Letaba in South Africa.
Discussion – can indicators/metrics guide resilience adaptation?
Accepting Schipper and Mukherji’s focus on adaptation financing (which is not my field), and “not all adaptation effectiveness can be measured” (p 626), we nonetheless should be interested in indicators that ex-ante reveal forthcoming resilience and adaptation trajectories and scenarios. In other words, we should be able to resolve what appears to be a contradiction in their final paragraph on page 626. With regards to conditionalities about financing adaptation, they write; “putting stringent conditions to prove that adaptation interventions are not maladaptive (because it is impossible to predict what will be maladaptive ex ante), or making funding conditional on metrics and measurements of effectiveness”.
The contradiction, to my mind, is on the one hand ‘metrics cannot predict what will be maladaptive ex ante’. but on the other hand ‘metrics and measurements are central to the discussion on adaptation’.
I agree with the second bit; metrics on adaptation and resilience are important (despite difficulties with them) but I disagree with the first bit about not being able to predict maladaptation. On the contrary, well-designed models, metrics and measurements, exemplified by DDZ, can predict the consequences of actions and trends that incrementally or even abruptly switch from being adaptive to maladaptive. The follow-up questions are; a) how to use these indicators e.g. in what fora; and b) how to redirect and/or transform systems that are evolving along maladaptive pathways? These questions represent a large subject area, which Schipper and Mukherji highlight. In that light, pathway transformation and redirection will be helped by seeing irrigation as nested complex systems comprising many variables and dimensions.
Acknowledgements. I thank Lisa and Aditi for discussions prior to this blog’s publication, and the co-authors of the two papers, Dorice, Kate, Jon, Mlu, Jerry, and Tim.
** This paper then led to the Water Alternatives Forum on a similar topic https://www.water-alternatives.org/index.php/blog/greenw
References
Lankford, B., Pringle, C., Mccosh, J., Shabalala, M., Hess, T. & Knox, J. W. 2023. Irrigation area, efficiency and water storage mediate the drought resilience of irrigated agriculture in a semi-arid catchment. Science of The Total Environment, 859, 160263.
Lankford, B. A. & Agol, D. 2024. Irrigation is more than irrigating: agricultural green water interventions contribute to blue water depletion and the global water crisis. Water International, 1-22.
Matthews, N., Dalton, J., Matthews, J., Barclay, H., Barron, J., Garrick, D., Gordon, L., Huq, S., Isman, T., Mccornick, P., Meghji, A., Mirumachi, N., Moosa, S., Mulligan, M., Noble, A., Petryniak, O., Pittock, J., Queiroz, C., Ringler, C., Smith, M., Turner, C., Vora, S. & Whiting, L. 2022. Elevating the role of water resilience in food system dialogues. Water Security, 17, 100126.
Schipper, E. L. F. & Mukherji, A. 2024. Misguided negative adaptation narratives are hurting the poor. Science, 386, 624-626.
Warner, J. F. & Meissner, R. 2021. Cape Town’s “Day Zero” water crisis: A manufactured media event? International Journal of Disaster Risk Reduction, 64, 102481.
